
# Debugging with Chrome
# Debugging Client Code with Chrome
# Debugging NodeJS with Chrome
En la terminal:
➜ node --version
v14.4.0
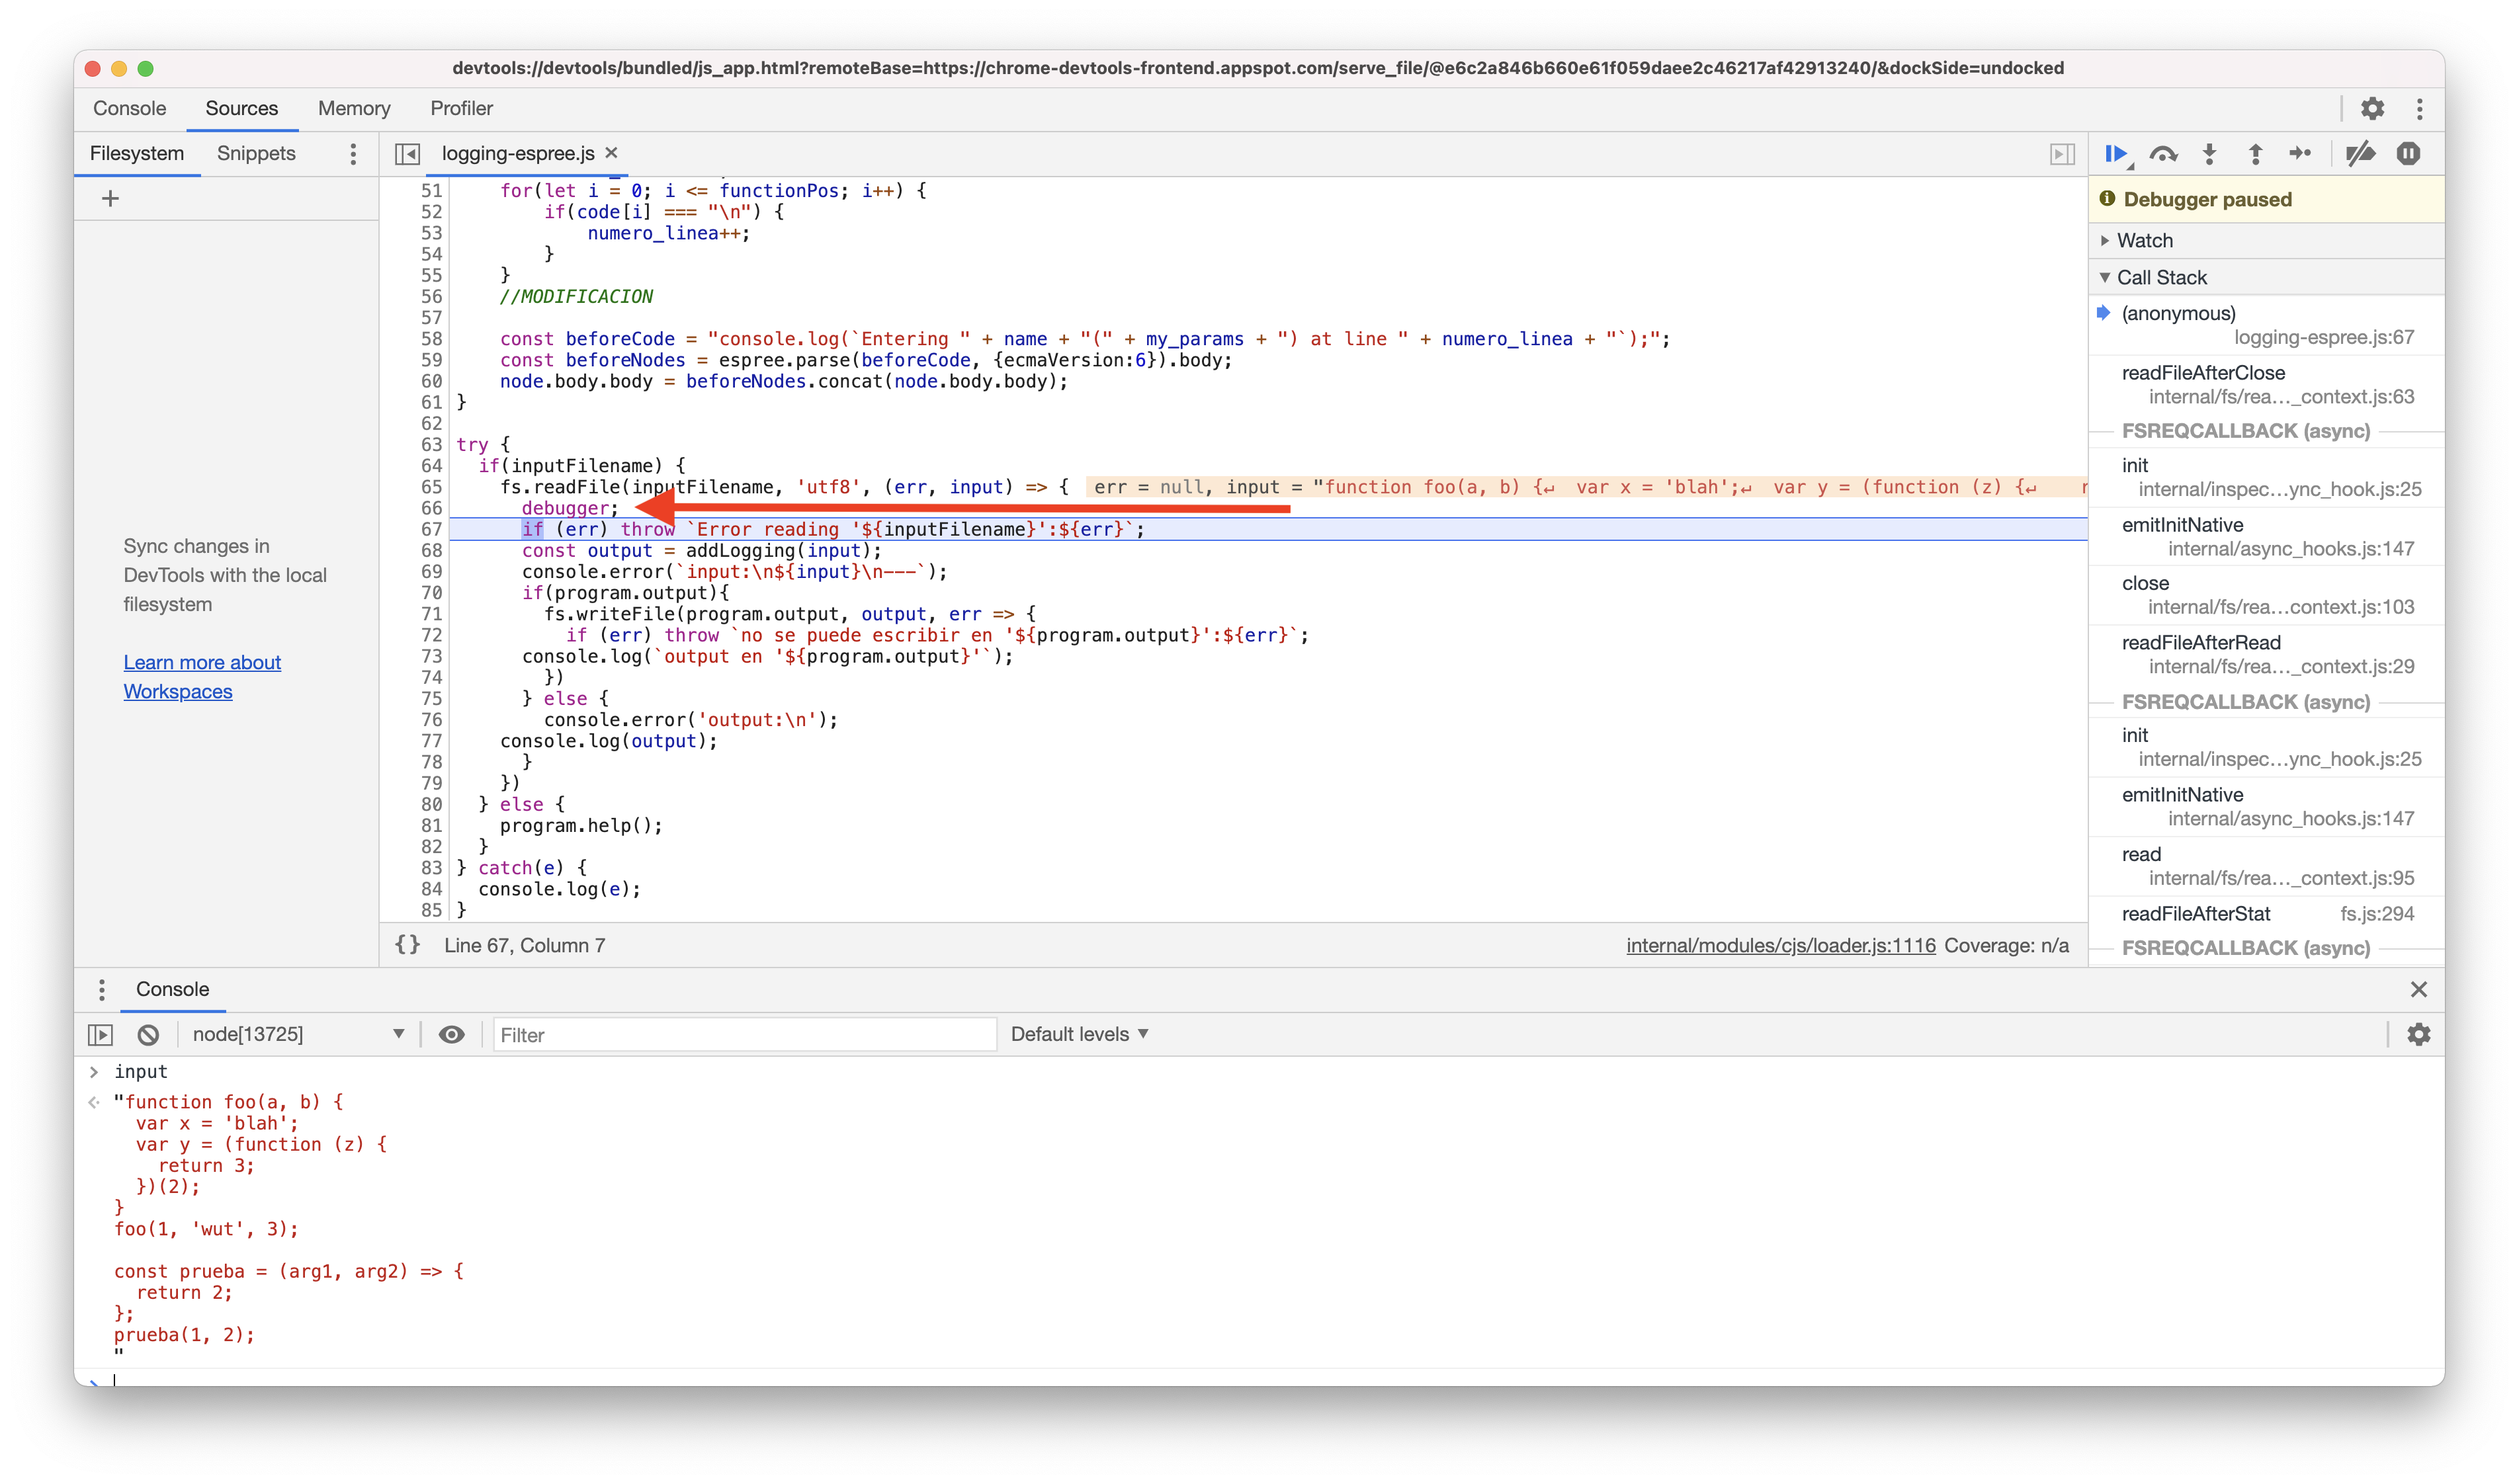
➜ node --inspect-brk logging-espree.js
Debugger listening on ws://127.0.0.1:9229/331b3011-c7f5-447f-8731-1371c53847a5
For help, see: https://nodejs.org/en/docs/inspector
1
2
3
4
5
2
3
4
5
the option --inspect-brk=[host:port] does the following:
- Enable inspector agent
- Bind to address or hostname
host(default: 127.0.0.1) - Listen on port
port(default: 9229) - Break before user code starts
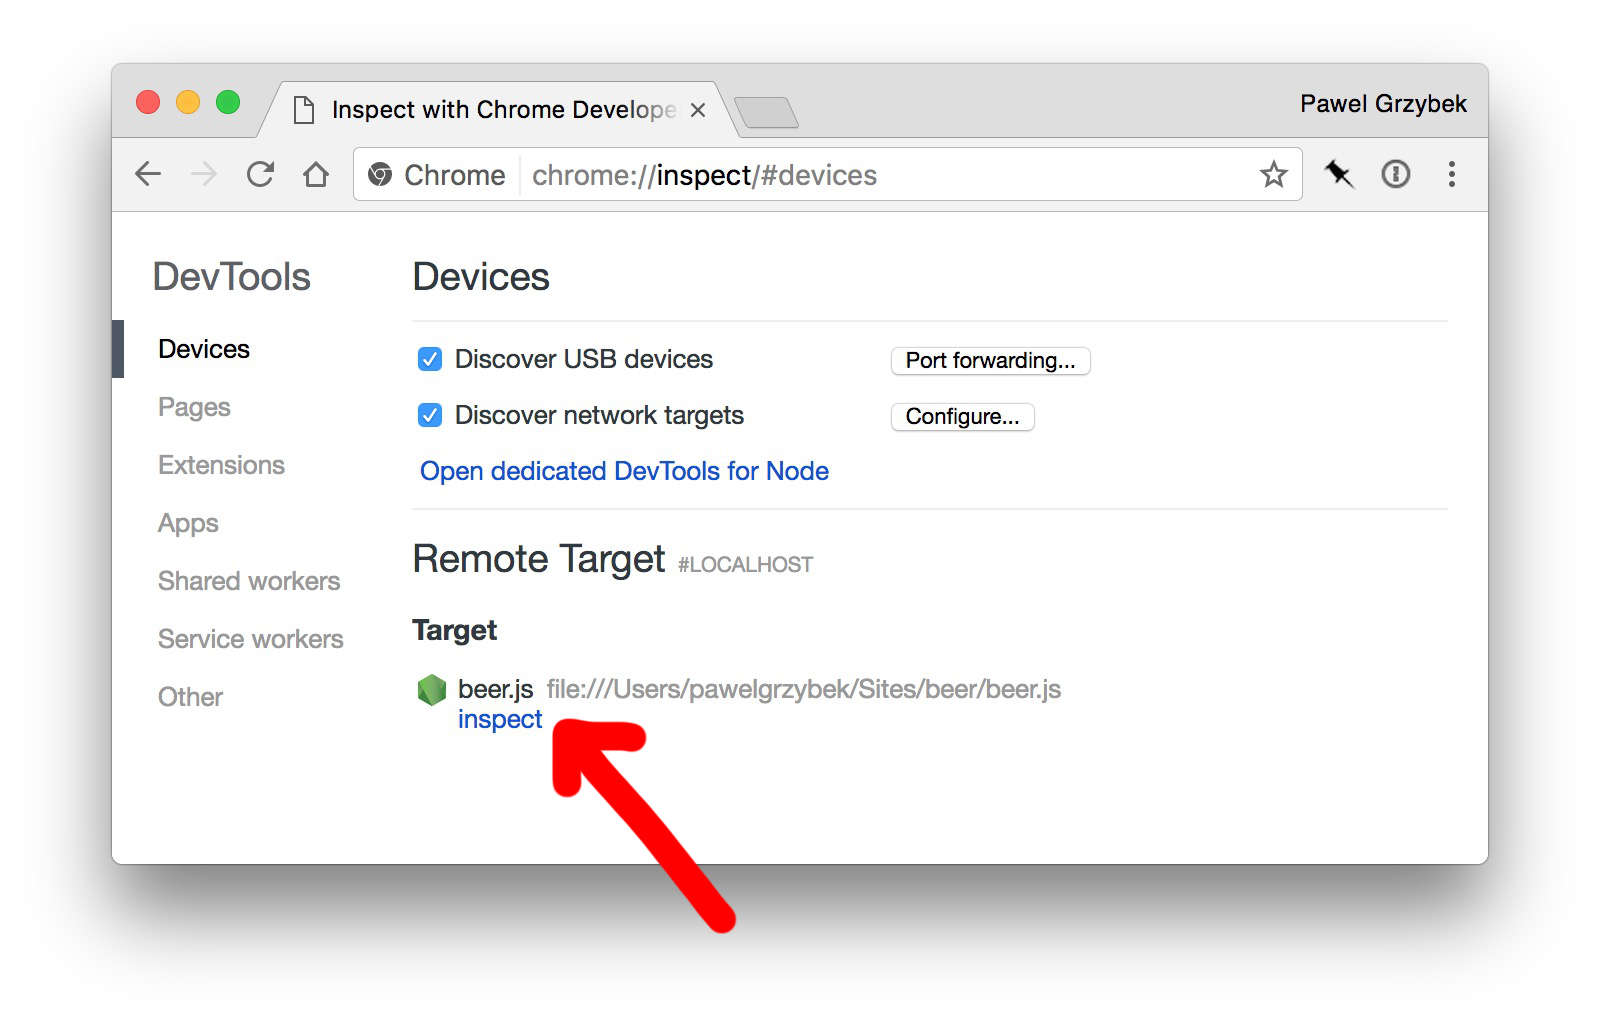
En el navegador abrimos la URL chrome://inspect y hacemos click en el enlace inspect
Insert debugger statements wherever you want to set a break-point:
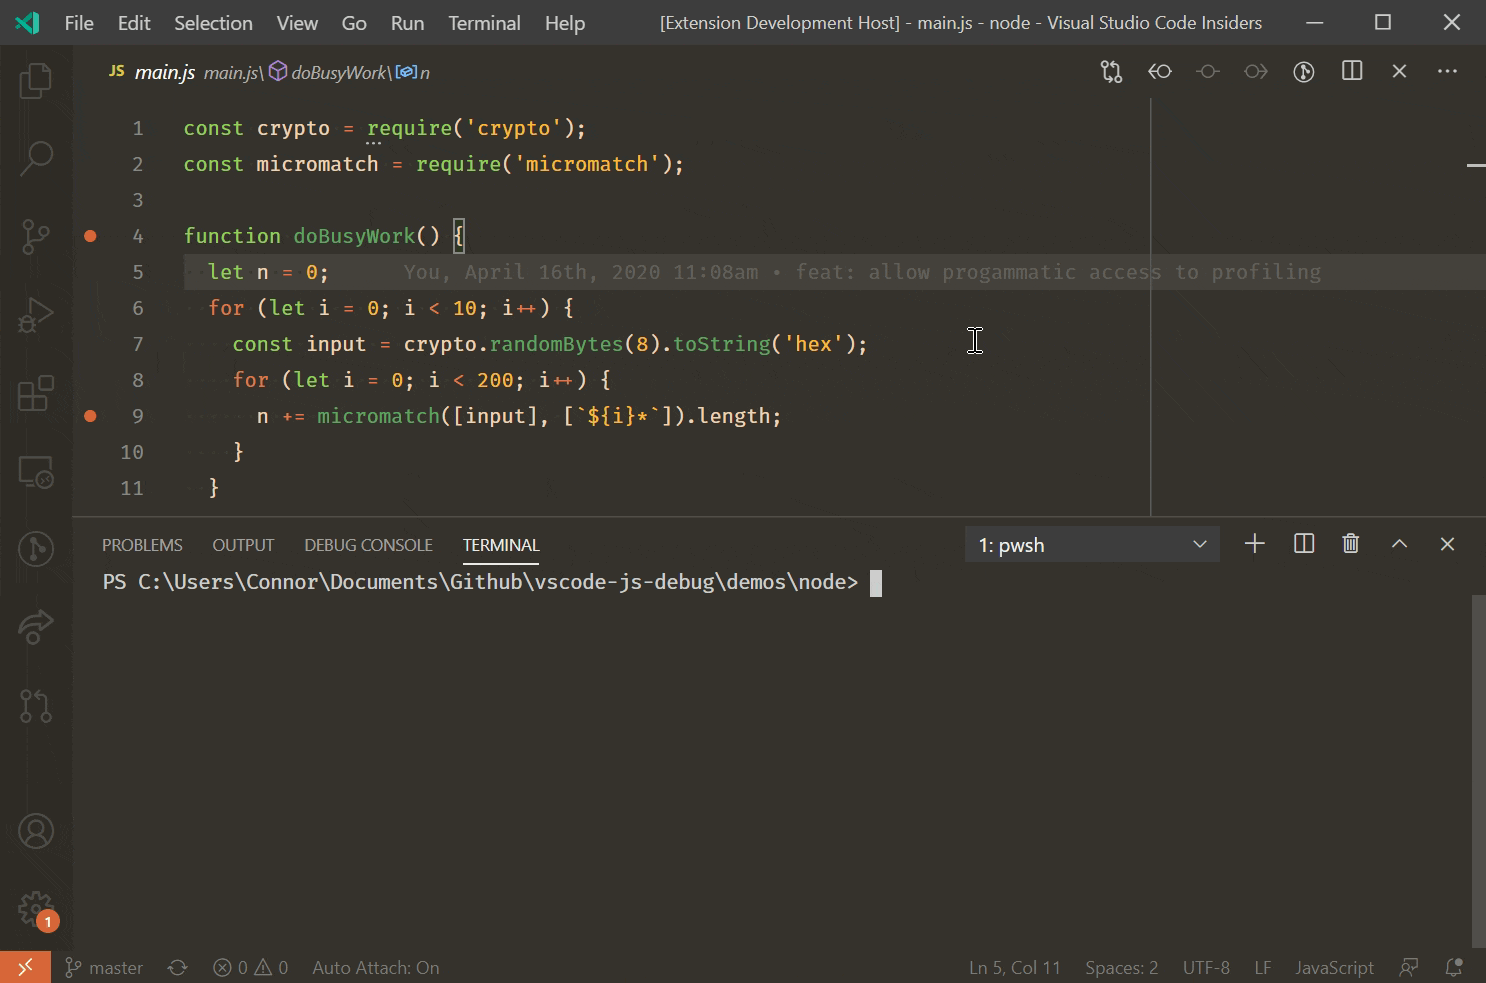
# Debugging with Visual Studio
If the Auto Attach feature is enabled, the Node debugger automatically attaches to certain Node.js processes that have been launched from VS Code's Integrated Terminal. To enable the feature, either use the Toggle Auto Attach command from the command palette (F1) or, if it's already activated, use the Auto Attach Status bar item
After enabling Auto Attach, you'll need to restart your terminal.
See Node.js debugging in VS Code (opens new window)
# References
- Node.js debugging in VS Code (opens new window)
- Node.JS Debugging Guide (opens new window)
- Apuntes del profesor de 2016: Debugging NodeJS (opens new window)
- Debugging in 2017 with Node.js YouTube video https://youtu.be/Xb_0awoShR8